
DYNAMIC TRANSIT
Your carriage.
Your destination.
Fewer stops.
What if your metro only stopped
where you needed it to?
Tell your phone where you’re going. Follow your boarding zone. Step into a carriage with people heading your way—and pass the stops you don’t need.
Follow a passengerA transport concept by Paul Beglin. Independently driven carriages share the fast lane, then separate for their own stops. The animations show the vision; the research tests whether it works.
01 / THE PASSENGER EXPERIENCE
Choose a destination.
The rest follows.
Follow one journey from your phone to the platform, then all the way to your stop. Four steps. One carriage.
Where are you heading?
Enter your destination. The system takes care of the stopping pattern.
FROM OLD TOWN
TRY IT · TAP YOUR DESTINATION
You choose the place. You don’t need to work out which service to take.
Who’s going your way?
Destination + available space + incoming carriages → your boarding zone.
Match the zone on your phone to the sign on the platform. Your carriage comes to you.
Your carriage continues. The Museum carriage takes its own exit.
Example journey: Old Town → Riverside.
Your stop is the commitment. The system groups compatible journeys before you board. Your carriage keeps its promised destination while the network adapts around it.
Guidance for everyone. Platform displays, staff support and accessible kiosks must provide the same experience without requiring a phone or precise location sharing.
02 / THE CITY IN MOTION
Now imagine
a whole network.
All those stops add up. Watch several trains move through central Paris: whole trains stopping together, or carriages serving a station while the fast lane keeps flowing.
A fixed stopping pattern
Every carriage waits at every station.
Choose a station to watch its stopping pattern.
Carriages with their own stops
Only the carriages serving this stop slow down.
Choose a station to watch its stopping pattern.
Leave a train. Stop at the platform. Accelerate back into the flow. A new group, the same carriage. More of the fleet spends its time carrying people forward.
What this comparison shows
Selected stations are spaced out so the movements stay readable. Both sides use the same carriage fleet, the same cruising speed and the same boarding time at each station. In fixed service, a three-carriage train stops together. In the dynamic illustration, one carriage serves each stop; the other two continue.
Departures are timed so a stopping carriage can join a later group. Traffic circulates continuously, with the return outside this cropped view. The counters describe the carriages in this illustration, including those just beyond the edge. They are not actual Paris service or measured passenger capacity. Extra station lanes are hypothetical; safe spacing, junctions, demand and infrastructure need the separate operational simulation.
Station positions: Île-de-France Mobilités GTFS ↗, retrieved 10 October 2026, Licence Mobilité ↗. Map curves and the background are drawn schematically.
03 / THE PHYSICAL NETWORK
A place to stop.
A path to pass.
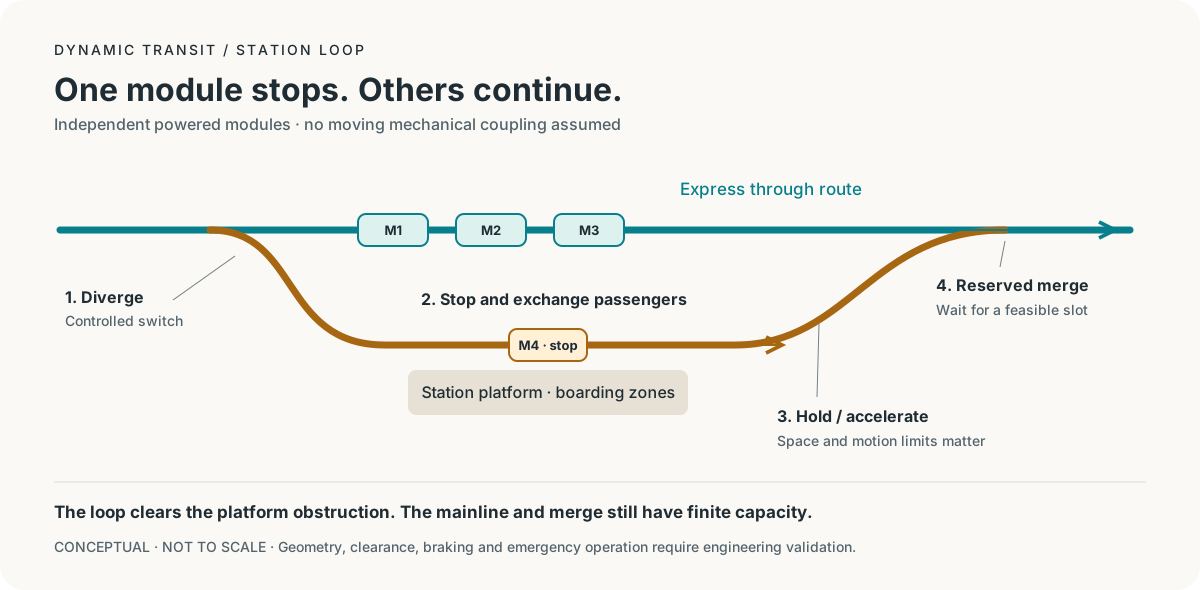
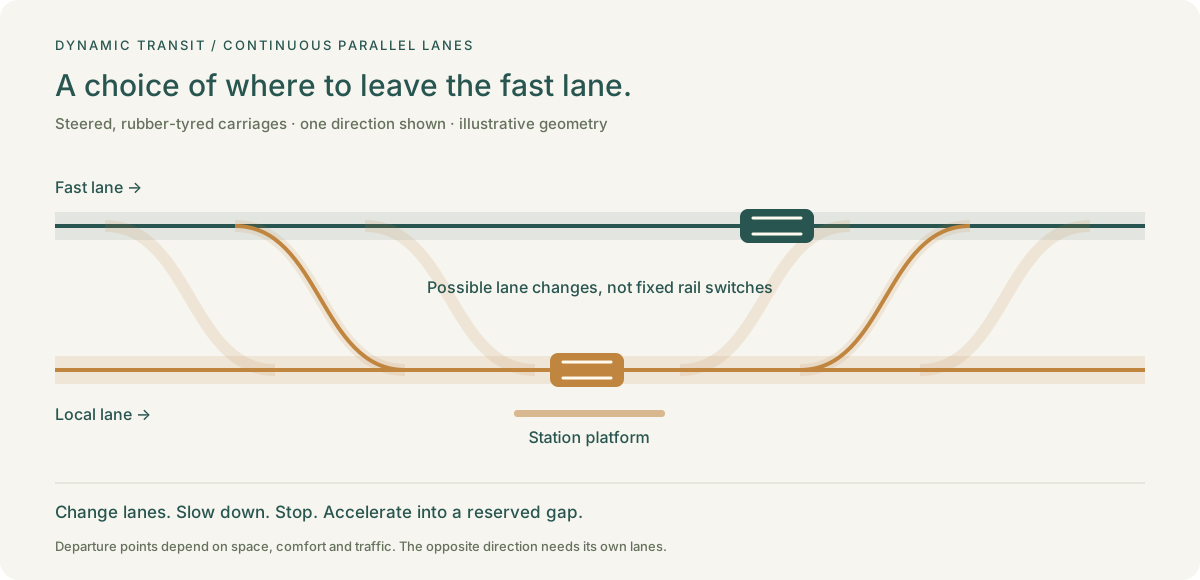
A carriage leaves the fast flow before slowing down. Passengers board on a separate lane, while the rest of the network keeps moving. Here are two ways to make room for that.
Swipe or scroll to explore the diagram →
Station bypass loops
Additional track is concentrated around each station. The loop needs a protected entrance, platform, braking approach and enough acceleration distance to rejoin the express flow.
Continuous fast + local lanes
Two lanes run continuously in each direction. Rubber-tyred carriages steer between them, like vehicles changing lanes. The departure point can adapt to the journey; it is not tied to a fixed rail switch.
How do you change lanes comfortably?
Start the turn early. Make the curve gradual. Slow down on the local lane, with enough room to brake before the platform. Speed, curve radius and jerk—the rate acceleration changes—all shape the route.
Those are engineering requirements to test. This drawing explains the movement; it does not specify a validated speed or turning radius.
04 / THE VEHICLES
A full-size carriage.
Independent movement.
Shared transport, with room to sit, stand and move. Each driverless carriage has its own power and brakes, so it can travel with the group—and leave when its passengers need to stop.
01Drives itselfOnboard control
02Powers itselfIndependent traction
03Stops itselfIts own braking
04Travels togetherCoordinated formations
How would the carriages travel together?
Standing capacity
A high-capacity interior for busy services.
More seated space
A comfortable option for longer journeys.
Accessible space
Level boarding, circulation and priority seating throughout the fleet.
Logistics modules
A later, separate study of cargo vehicles and shared-network scheduling.
05 / THE COMPUTATIONAL IDEA
Same destination.
A smarter way there.
Think of how Waze finds another route when a road gets busy. A connected transit network could do the same for whole carriages, spreading journeys across the routes with room to carry them.
Room on the direct route.
Both carriages can travel through City Centre. There’s space for their journeys.
Try “City centre busy” to see the next departures use both routes.
The internet-inspired part:give each carriage a destination, then coordinate its path through the network. Passengers keep their destination; the system adapts the route.
Request a journey
Origin, destination, accessibility needs and a boarding commitment.
Group & schedule
Assign capacity and stop patterns to reduce total passenger journey time.
Authorize movement
Reserve track, protect switches and merges, and enforce safe separation.
Optimize the whole journey:
walk + wait + board + ride + transfer + walk
06 / THE SIMULATION STUDIO
Test the idea.
Observe the network.
The simulator now has its own application. Explore Paris lines 1, 6, 8 and 10 on a street map, replay vehicle movements, inspect passenger flows and compare four services with the same requests.
Choose a synthetic corridor, Paris station entries with hourly profiles, or London's Victoria line with TfL origin–destination data. The studio exposes waiting, completed and unfinished journeys alongside every comparison.
Open the independent simulator ↗
RESEARCH MODEL · PRIVATE TAILSCALE PREVIEW
Paris destinations and line allocation remain inferred. London uses adjusted typical-day line journeys; its clock-bin convention still needs current-year confirmation. Vehicle inventories, express infrastructure and signalling remain research assumptions. Earlier batch results are superseded following dispatcher corrections; current comparisons live in the studio.
07 / FROM VISION TO EVIDENCE
Start small.
Keep the question big.
The independent studio starts with reproducible corridors and documented demand scenarios. The next task is to challenge its assumptions and validate the model before drawing conclusions about a real network.
Does skipping stops save more time than grouping, boarding and safe merging add—while carrying the same demand?
A visible concept
Destination assignments, two track layouts and clear modular vehicle movements. The page you are exploring is this first step.
A genuine simulation
Replay identical passenger requests through all-stop trains, fixed local/express service and dynamic modules. Model finite fleets, waiting, dwell and protected merges.
A reality check
Use documented distances and demand assumptions for a selected corridor. Separate real geography from hypothetical express/local infrastructure.
A feasible network?
Investigate signalling, geometry, coupling, resilience, costs and evacuation. Expand to connected corridors only once the small model is credible.
What the simulator must reveal
Average, median and high-percentile total journey times; waiting and unfinished trips; throughput, occupancy, empty vehicle movement and merge queues. Include passengers whose journeys become worse.
Compare equal demand and explicit fleet and infrastructure budgets. A conventional local/express service may outperform dynamic dispatch in some conditions. That is a useful result.
Test low demand, directional rush-hour peaks, dispersed destinations, rare trips and failures. The animations on this page use illustrative geometry and fixed example groups; no operational performance results are claimed.
The network adapts
to where people want to go.